Fourteen years of profitable growth
Built on a solid foundation with a track record of 14 consecutive years of profitable growth supported by a large ecosystem of partners and a strong balance sheet.

* All figures exclude one-off income and expenses, in order to more accurately reflect the core business performance.
Core business results*
Units in the charts are represented in millions of euros.
| 2021 | 2022 | 2023 | 2024 | 2025 | |
|---|---|---|---|---|---|
| Net interest income | 40.0 | 48.1 | 53.4 | 67.5 | 74.2 |
| Net rental income | 4.5 | 6.4 | 9.6 | 12.0 | 14.7 |
| Net result from commissions and financial items | -1.8 | -3.1 | -2.8 | -3.0 | -3.8 |
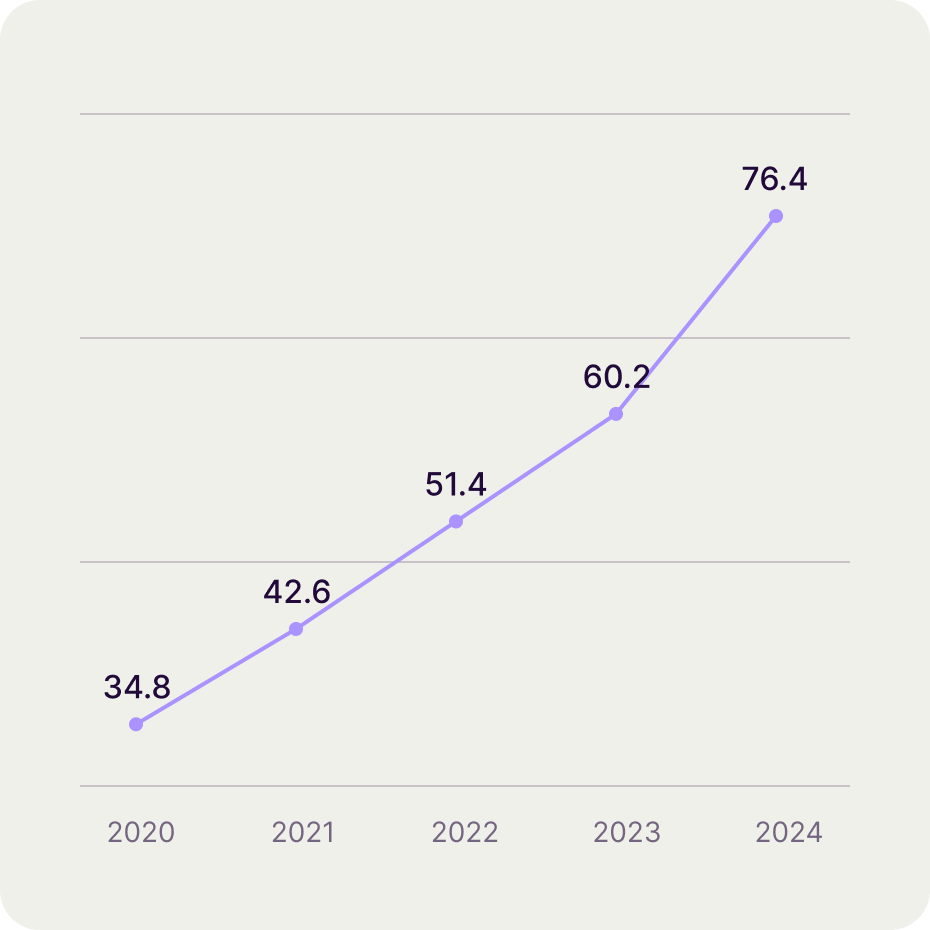
| Total net income | 42.6 | 51.4 | 60.2 | 76.4 | 85.1 |
| Total operating expenses | 24.0 | 30.3 | 36.9 | 43.2 | 46.3 |
| Operating profit | 18.6 | 21.0 | 23.2 | 33.2 | 38.8 |
| Impairments | 6.7 | 11.2 | 13.2 | 16.4 | 19.3 |
| Income tax | 1.3 | 0.2 | 1.6 | 1.5 | 1.9 |
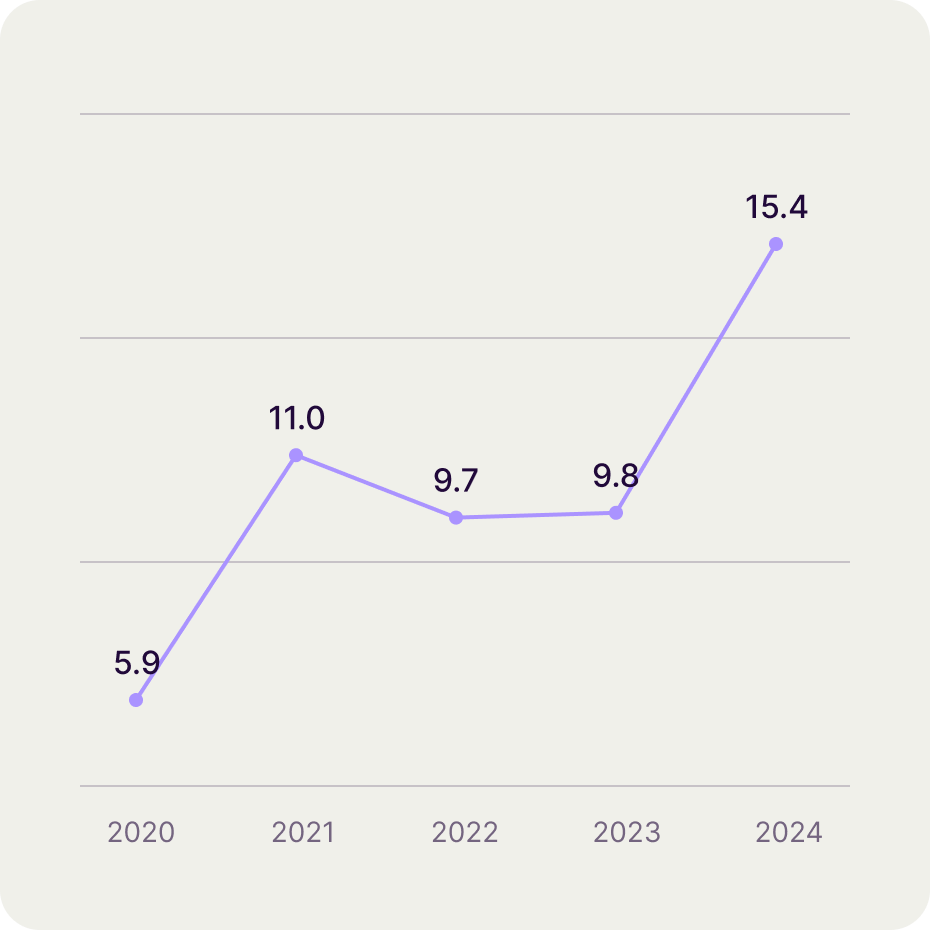
| Net profit | 11.0 | 9.7 | 8.2 | 15.4 | 17.6 |
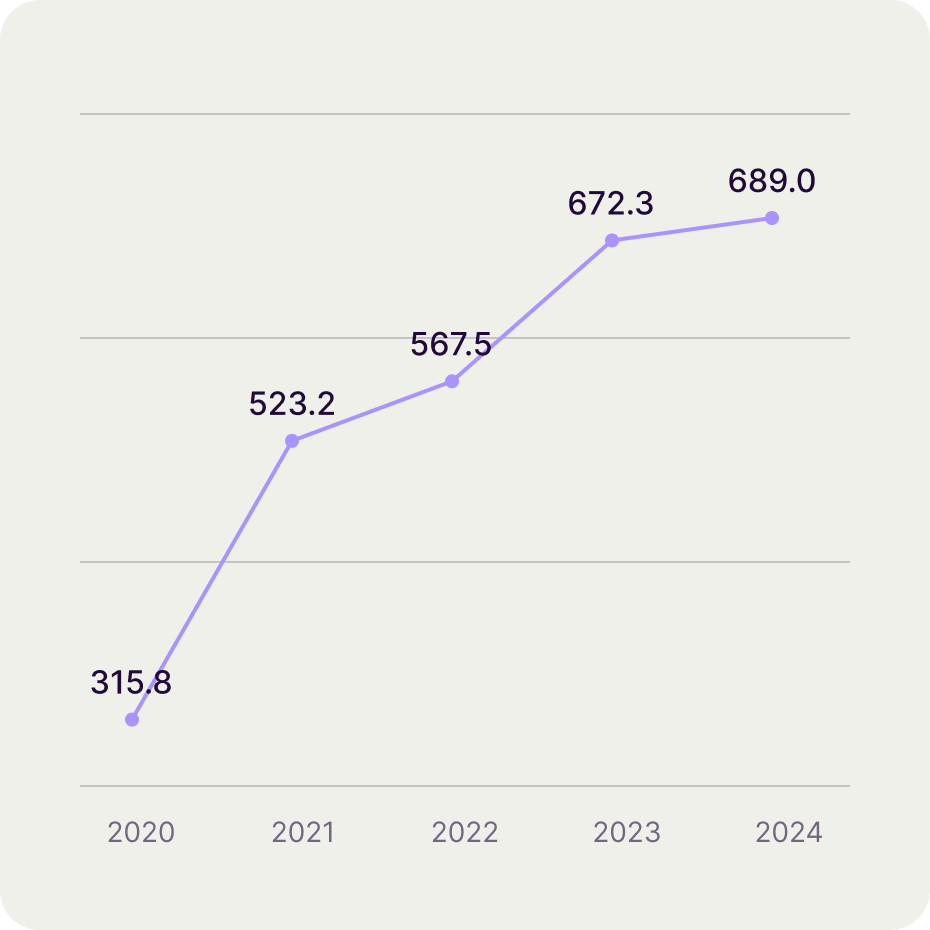
| Originated volume | 529.3 | 574.9 | 680.5 | 696.7 | 769.6 |
| Total assets | 787.0 | 1 020.5 | 1 320.6 | 1 435.8 | 1 580.0 |
| Loan and rental portfolio | 638.7 | 818.2 | 1 034.2 | 1 155.1 | 1 276.7 |
| Customer deposits | 617.9 | 828.9 | 1 081.6 | 1 171.4 | 1 301.1 |
| Equity | 79.0 | 101.9 | 124.1 | 147.6 | 171.0 |
| Portfolio yield | 10.6% | 10.2% | 10.9% | 11.3% | 11.1% |
| Funding cost | 1.7% | 2.6% | 4.5% | 4.4% | 4.0% |
| Total income margin | 6.5% | 5.9% | 5.2% | 5.4% | 5.5% |
| Impairments / portfolio | 1.3% | 1.5% | 1.4% | 1.5% | 1.6% |
| Cost/income ratio | 56.3% | 59.0% | 61.4% | 56.6% | 54.4% |
| Return on equity | 16.3% | 10.8% | 7.5% | 11.3% | 11.2% |
* All figures exclude one-off income and expenses, in order to more accurately reflect the core business performance.
Newsroom
Careers
Make the smart move
We’re always on the lookout for driven and enthusiastic people. If you love what you do, and want to elevate your career, come and climb the highest tops with us.
Join us